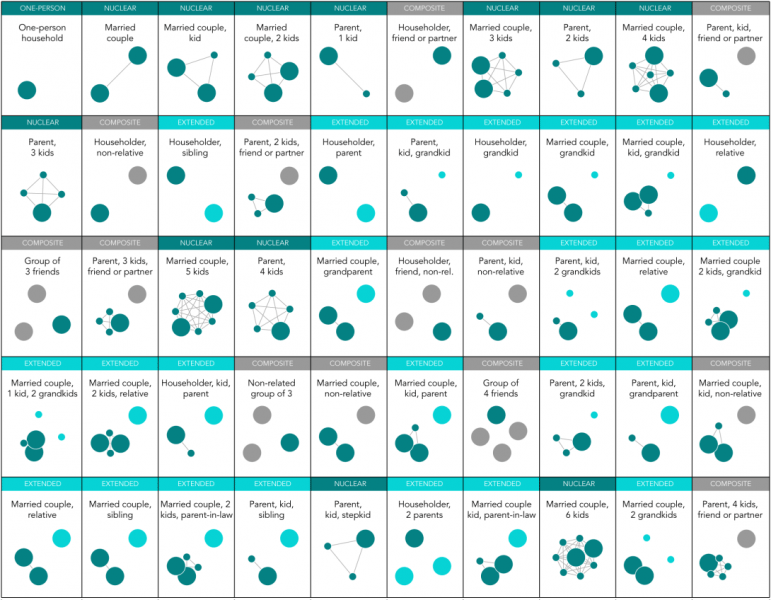
Larger circles represent adults, while smaller ones are children or grandchildren. The circles are colored dark green for those in the household’s family nucleus, light green for family members outside the nucleus and grey for non-relatives. The household types are categorized based on the definitions used by the United Nations.In totality, these 50 types represent about 94 percent of the families in America. Though “nuclear” families still make up the majority, it’s a slim margin at only 54 percent. That leaves an awful lot of families out there that don’t fit the “typical” model adhered to by many planners and represents a great opportunity for those willing to expand their understandings of “family.” After all, by Yau’s count, the 6 percent of American families that aren’t represented in the infographic consist of another 10,226 permutations.
Source: The 50 Most Common Family Types in America
In other Family Protection news…
- Teachers banned from calling students “boys and girls”
- Macy’s fires Catholic employee for questioning transgender bathroom policy
- California public schools to begin teaching gay history, starting in second grade
- British Muslim cleric tells boys they can have sex slaves
 If attacked, do you want to be Victor or Victim?
At SacredHonor.US, we hate it when people die embarrassed.
And at Protect.FM, we believe good estate plans protect families.
We make it easy for your family to attain the comfort of skill at arms.
David R. Duringer, JD, LL.M, is a concealed firearm instructor and tax lawyer specializing in business and estate planning; licensed to practice law in the states of California and Washington. He is managing shareholder at Protective Law Corporation, serving Southern California from its Laguna Hills (Orange County) headquarters and satellite offices in San Diego County (Coronado and Carlsbad).
© Protective Law Corporation as per date of publication captioned above. All rights reserved unless otherwise noted. Sharing encouraged with attribution and/or link to this page.
COMMENTS:
To comment on this post, look for it on our Facebook and Twitter pages.


